Robert Sutton, Executive Vice President of Innovation at BNSF Logistics, reviews how month-over-month market and economic factors affect transportation and the supply chain.
RETAIL SALES SLOWING BUT STILL GREATER THAN LAST YEAR
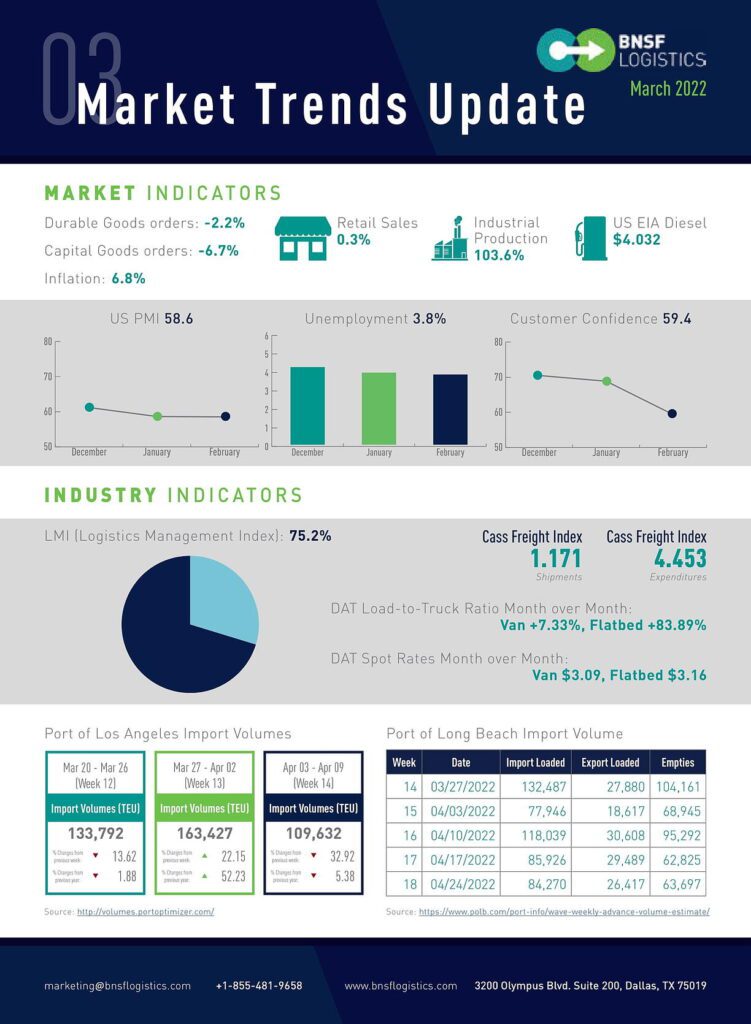
678,000 new jobs were created in February, dropping the U.S. unemployment in February to 3.8%, down 0.2% from last month. This is still slightly above early 2020 but is in line with where things were in 2019, both in terms of the unemployment rate and payroll employment. The labor participation rate improves once again but is still almost a full percentage behind the level it was in early 2020. It is expected that this gap will close over the coming months as things continue to normalize. Initial unemployment and continuing claims recently declined to the lowest level since 1970, showing that the market conditions for labor are still extremely tight. The latest reports show that there were still 11.2 million open positions at the end of January, a record beaten only by December, which was at 11.4 million. This is about 60% more open positions compared to pre-pandemic numbers (7 million). The economy will continue to be challenged by this until more people are attracted back to the workplace, meaning there will likely be continued upward pressure on wages as businesses fight to attract talent.
Retail sales rose 0.3% in February (not adjusted for inflation) and are 17.6% higher than last February. The monthly rate of growth however is below the rise in prices, which was 0.8%, suggesting weakness in underlying activity levels. Food and drink establishments led the way with a 2.4% increase after falling 0.5% in January as the impact of Omicron waned and will likely continue to see an increase in the coming months, now up a solid 33% year over year. Retail sales growth is expected to slow in the near term due to a reduction in disposable income as well as the decline in personal savings rates below pre-pandemic levels and the rising costs of borrowing as the Fed steps up interest rate hikes in an effort to rein in inflation. The core inflation, which excludes food and fuel prices, rose 6.4%. Consumer sentiment, which tends to be a leading indicator, declined in March due to falling inflation-adjusted incomes, which were recently accelerated by rising fuel prices.
Privately-owned housing starts in February rose to a seasonally adjusted annual rate of 1,769,000, which is 6.8% higher than the revised January estimate (1,657,000) and is 22.3% higher than a year ago. Single‐family housing starts rose to 1,215,000, 5.7% higher than the revised January figure of 1,150,000. The February rate for units in buildings with five units or more rose to 501,000, 0.8% higher than January (497,000) and 37.3% higher than a year ago.
The 1.77-million-unit pace is the strongest pace of new residential construction since the end of 2006.
Given that homebuilders have continued to struggle to work through their order backlogs despite materials and labor scarcity issues, there’s still strong near-term support for new housing construction. Permits, which are a leading indicator of future starts, are down modestly month over month, suggesting that builders may be growing more concerned about affordability challenges ahead as rates continue to rise. However, record low existing-home inventory and millennial demand are supportive of new construction, but builders still face persistent obstacles that make it difficult to bring more new homes to the market.
Automobile sales in February totaled just 14.1 million units, down 6.4% from January. Despite this decline, Q1 2022 is tracking to be the highest sales since Q2 2021. New light-vehicle sales are expected to improve throughout the year but will continue to be restrained by the ongoing semiconductor microchip shortage and other supply chain-related issues.
New vehicles continue to sell relatively quickly, spending an average of only 20 days on dealers’ lots in February, down from an average of 54 days a year ago. This impacts trade-in values, which have increased due to overall market demand for vehicles. It is expected that new light-vehicle sales will continue to be limited by available inventory for the rest of the year. With borrowing costs increasing, which drives up monthly payments, this will put some damper on new sales. Despite these challenges, we forecast that light-vehicle sales will increase this year to 15.4 million units.

LOGISTICS INDUSTRY EXPANDING
The Purchasing Manager’s Index (PMI) for February was 58.6%, a 1-point increase from January. This still indicates expansion in the PMI for the 21st consecutive month after the contraction in April and May of 2020 (anything greater than 50 equals growth). Durable goods orders decreased significantly by 2.2% in February, much more than the expected 0.5% decrease. Unfilled orders and inventories both increased by 0.4%, while capital goods decreased by 6.7%.
The Logistics Management Index (LMI) for December was 75.2, a 3.3-point increase from January and the second-highest reading in the history of the index. The LMI index has been above 70 for 13 consecutive months, as well as 16 of the past 18 months, indicating significant expansion, with no obvious signs of a slowdown on the industry 4.0 market horizon. Like January, this month’s growth is driven by rapid growth in inventory levels. This is the complete opposite from last fall when firms were struggling to build up inventories. A combination of over-ordering to avoid shortages, late-arriving goods due to supply chain congestion, and a softening of consumer spending has created a logjam with inventory levels a full 21.4 points higher than they were in November. Transportation capacity was 44.4% in February, down 0.3% from January, while transportation utilization is up 6.1 points to 68.5%. Additionally, transportation prices dropped by 0.3 points to 89.0% in February. Looking at the other factors that make up LMI, warehousing and inventories, February showed a decrease of 4.6 points to 43.4% for warehouse capacity, an 0.5 -point increase to 86.4 in warehousing prices, and an increase of 2.3 points to 90.3 for inventory costs, while the inventory level is up 9.1 points to 80.2%, crossing the 80.0 threshold for the first time.

